 Configuring Dashboards
What is a dashboard? Your personal start page in the app – with tiles or a list for quick access to your most frequent actions.
Dashboard Basics
Dashboard tile → Tap         → Record event
               → Long press  → Open event history
You can create as many dashboards as you like and switch between them – similar to iPhone home screens.
Creating a New Dashboard
Navigation
 Settings →
Dashboards
fig.↗
→
Settings →
Dashboards
fig.↗
→  (Plus)
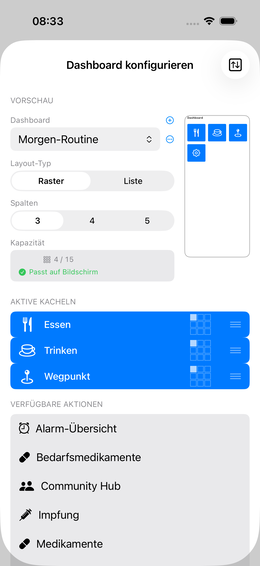
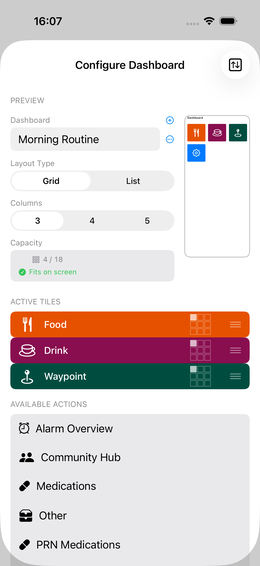
Selecting Actions
In the list of “available actions” you see:
- All your
 parameters (individually)
 - All your
 parameter groups
  Food and Drinks (always available)
 Waypoints (always available)
Activate: Tap an entry → it moves to the active list at the top.
Deactivate: Swipe left in the active list → Deactivate. Your configuration is preserved.
💡 Every new dashboard automatically gets a settings switcher tile added. This lets you switch directly between your dashboards from the dashboard itself, without going into Settings manually.
Choosing a Layout
Tap “Layout”:
| Option | Appearance | Good for |
|---|---|---|
| List | Compact list view, colorful | Many parameters, text-heavy |
| Tiles 3 | 3 wide tiles per row | Few, important parameters |
| Tiles 4 | 4 medium tiles | Balanced mix |
| Tiles 5 | 5 small tiles per row | Many parameters at a glance |
Adjusting Tile Size
In tile view you can enlarge individual tiles:
- Tap the grid icon to the left of the drag icon on a tile
- Select the desired size (1×1, 2×1, 2×2, …)
- The mini-dashboard in the preview shows the effect immediately
Example: 4-tile grid
  [ Headache ][ Fatigue ][ Energy ][ Mood ]
  [    Blood Pressure (2×1)       ][ Pulse ][ Weight ]
Adjusting Tile Color
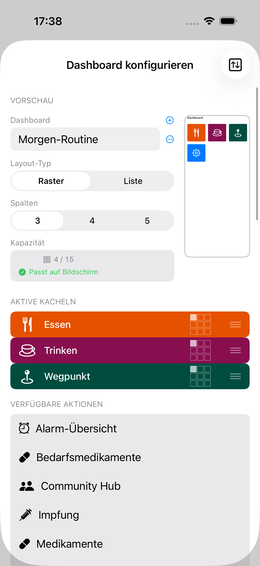
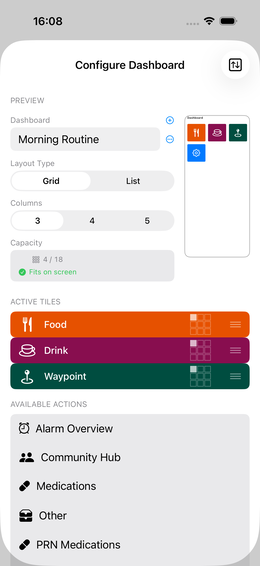
Tap a tile in the Dashboard Editor fig.↗ to open the editor. A card grid opens with the tile’s editing options.
Every parameter and group tile can be individually colored — tap the “Content & Icon” card → “Appearance” section → “Palette” fig.↗.
A sheet opens with three sections:
1. Choose palette — horizontally scrollable mini-preview of all available palettes. The chosen palette determines which colors are available in the next sections. The current app palette is pre-selected.
2. Background color — 30 fields from the chosen palette. Tapping applies the color immediately to the tile preview.
3. Symbol/text color — 5 base colors (black → white). There’s also an auto-contrast button: it automatically selects black or white, whichever is more readable on the chosen background.
💡 Besides the palette sheet there are also direct color pickers for background and symbol color – for any colors not contained in a palette.
Understanding the Capacity Display
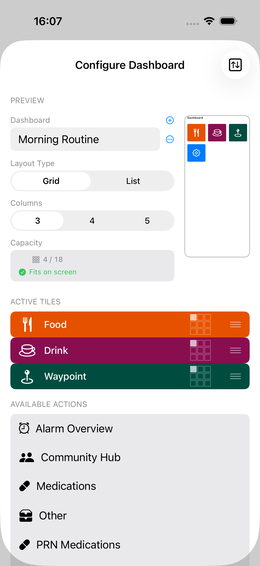
The app calculates how many tiles fit on screen:
Capacity: 17 of 18 available, but 2 tiles clipped- Green: All active tiles fit
- Orange triangle on a tile: this tile will be clipped
- Solution: Reorder tiles in the active list
Sorting tiles: Long-press the  drag icon
(3 lines on the right) → drag up or down.
drag icon
(3 lines on the right) → drag up or down.
Exporting and Importing Tiles
You can export the active tiles of a dashboard as a template and share it with other devices or the community.
Exporting Tiles
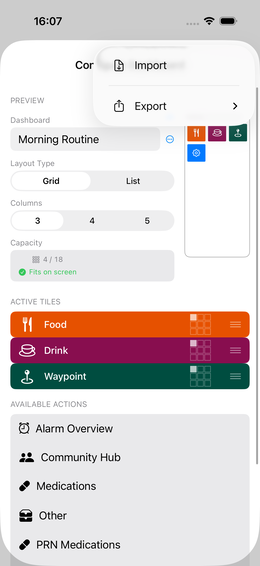
Settings → Dashboards → select
dashboard → Import/Export symbol (arrows, top right) →
“Export active tiles”
The app creates a .ioom file with all active tiles
including their parameters and groups. You can share it directly via
AirDrop, Mail or iCloud.
Sharing Tiles to the Community Library
In the same export menu there’s also “Share to Community Library”. A two-step sheet opens: first you select a single tile from your list (parameter or group tiles), then you enter a description and upload it. The tile then appears in the template library where other users can download it.
Importing Tiles
Settings → Dashboards → select
dashboard → Import/Export symbol →
“Import”
Or: tap a tile template in the template library → “Download”
Selective Import
After opening a tile template you see a selection dialog with a checkbox list of all included content:
☑  Tile "Migraine"          → will be added to the dashboard
  ☑  Parameter: Intensity   → will be created
  ☑  Parameter: Duration
☑  Tile "Sleep group"
  ☑  Group: Sleep
    ☑  Sleep onset
    ☑  Sleep quality
☑  Tile "Meal"               → special tile, no sub-level
You can deselect at every level: - Deselect tile → tile not added, but content (parameter/group) can still be imported - Deselect group → individual group parameters still selectable (created as standalone parameters) - Deselect parameter → only this parameter is not imported
Select all / Deselect all via the quick-select at the top of the list.
Using Multiple Dashboards Effectively
| Dashboard | Tiles |
|---|---|
| “Morning” | Sleep, energy, mood, weight |
| “Evening” | Pain, wellbeing, daily review |
| “Nutrition” | Food, drinks, hunger, portions |
| “Sport” | Training, intensity, heart rate, recovery |
Switching Between Dashboards
Swipe left or right on the dashboard to switch between your dashboards.
Mini-Preview Tile
You can place a special mini-preview tile on a dashboard that shows a scaled-down preview of another dashboard – useful for example to always keep the medication stock in view while tracking on another dashboard. Tapping the tile navigates directly to that dashboard.
Alarm Overview Tile
The alarm overview tile shows the status of all configured alarm slots at a glance:
- Number of active alarms relative to the total
(e.g.
3/5) - Next trigger – time of the next ringing alarm
- If no alarms are configured: hint “No alarms configured”
Tap the tile → detail view “Alarms” opens with all slots, their time, recurrence pattern (daily / weekdays) and status (active / disabled / next trigger).
💡 The tile captures all alarm slots – both tile reminders and medication alarms. Especially useful if you want to keep alarms from different areas in one central view.
Dashboard for Different Devices
As of v1.13, the tile column count automatically adapts to your actual screen resolution — previously it was frozen at 3 columns regardless of device. You can use the same dashboard on iPhone, iPad, and Mac: the app automatically picks a fitting column count for each screen size, with no manual re-creation needed.
💡 Bigger layout differences between devices (e.g. an entirely different tile arrangement per device) are planned for a later release — for now, only the column count adapts automatically.
If You Get Lost in the App
Close the app completely (double-tap Home or swipe up → swipe away the app) and restart it. You always land on your dashboard.