 Configuring Parameters
What is a parameter? It describes what you want to track – and how the values should be interpreted for analysis.
Before You Start: 5 Questions
Take a moment to answer these questions for your new parameter:
- What exactly am I measuring? (Be specific: “Headache intensity” rather than “pain”)
- Which data type fits? (Number, text, scale, …)
- Is there a sensible value range? (e.g. 1–10, 36–42°C)
- What does a high/low value mean? (Better? Worse? Neutral?)
- How do I want to enter the value? (Slider, dropdown, text input, …)
💡 Parameters can be adjusted later. Even so, a moment of planning saves effort down the line.
Creating a New Parameter
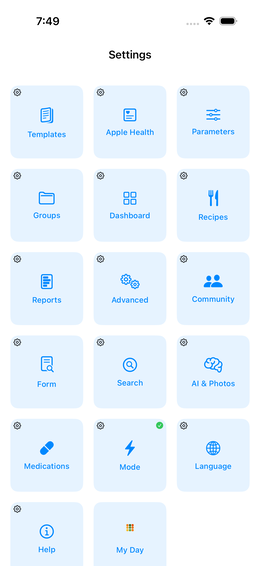
Step 1: Navigate
![]() Settings →
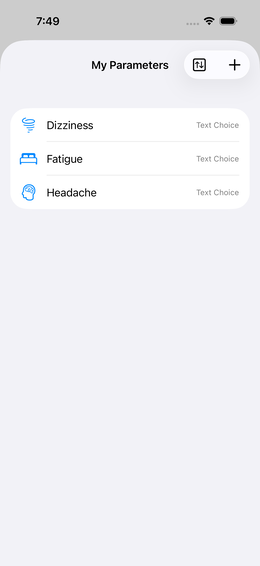
Settings → ![]() Parameters →
Parameters → ![]() (Plus, top
right)
(Plus, top
right)
Step 2: Choose an Icon
Tap the icon field → ![]() search for a fitting term → tap
the icon.
search for a fitting term → tap
the icon.
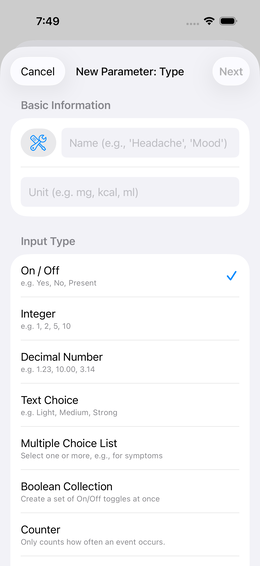
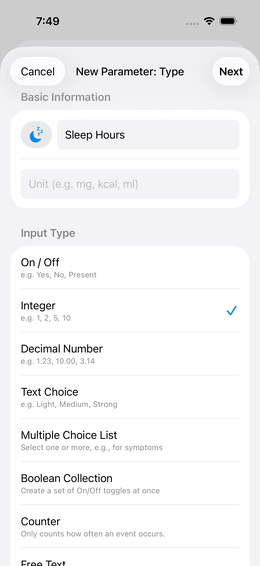
Step 3: Enter Name and Type
| Setting | Meaning | Example |
|---|---|---|
| Name | What the parameter is called | “Headache” |
| Type | Kind of values | Integer |
Available types:
| Type | Description | Examples |
|---|---|---|
| Integer | Whole numbers | Sleep hours, number of coffees |
| Decimal | Numbers with decimals | Body weight, blood pressure |
| Text value | Fixed selection of text options | mild / moderate / severe |
| Free text | Free text input | Dream diary, notes |
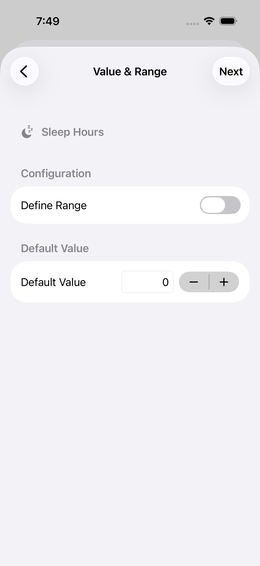
Step 4: Set Value Range (optional, numeric types only)
You can define a minimum and maximum value. This:
- Restricts input to meaningful values
- Sets the boundaries of the rating scale
Values outside the range are still saved, but linked to the boundary rating.
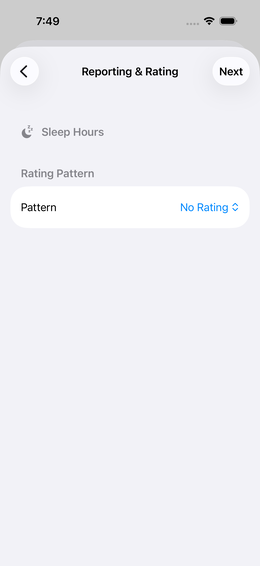
Step 5: Set a Rating Scheme
For the app to detect correlations it needs to know whether a value is “good” or “bad”.
The rating scale goes from -100% to +100%:
-100% ████████████░░░░░░░░░ 0% ░░░░░░░░░██████████ +100%
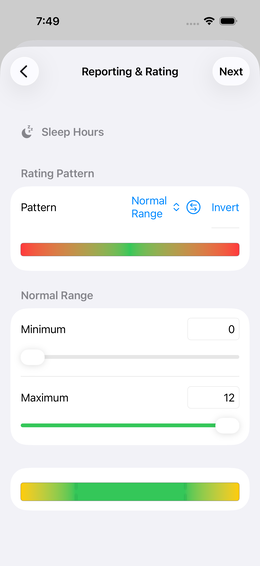
red (bad) yellow (neutral) green (good)Available patterns (examples):
| Pattern | Description | Use case |
|---|---|---|
| Normal range | A middle range is “good”, everything outside is worse | Blood pressure, temperature |
| Higher is better | The larger the value, the greener | Sleep hours (up to a maximum) |
| Lower is better | The smaller the value, the greener | Pain scale |
| Uniform | All values neutral (no rating) | When you just want to collect data |
Example: Blood pressure (systolic):
Normal range: 100–129 → green
< 100:  increasingly red (too low)
> 129:  increasingly red (too high)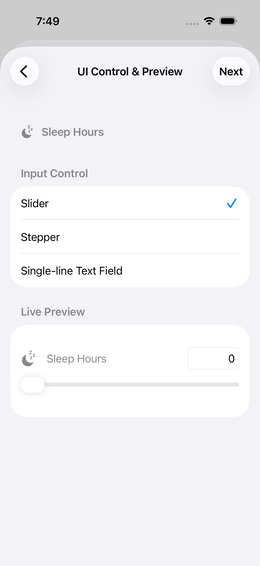
Step 6: Choose Input Control
Define how you enter the value during tracking:
| Control | Best for |
|---|---|
| Slider | Numeric ranges, quick assessment |
| Stepper (+/-) | Count values (number of coffees, glasses) |
| Dropdown / Select | Text values with a fixed list |
| Text input | Free text |
| Text stepper | Text values in a fixed sequence |
💡 The live preview shows you immediately how the input will look – try out different options!
Step 7: Finish
Tap “Done” → you get a confirmation and return to the settings list.
Editing a Parameter
Tap an entry in the parameter list → change settings → “Done”.
⚠️ Important: If you change the rating, the analysis will be recalculated with the new settings. The event data itself remains untouched.
Assigning a Parameter to a Dashboard
A parameter on its own doesn’t do anything – it needs to be activated on a dashboard:
Frequently Asked Questions
How many parameters should I create? Start with 5–10. Too many parameters at once → less consistent tracking.
Can I import parameters from the template library?
Yes – via the template library you can download ready-made
![]() parameter groups (including their parameters). →
Template Library
parameter groups (including their parameters). →
Template Library
Can I delete a parameter? Yes, but all associated event data will be lost. If you just want to hide it, deactivate it on the dashboard instead of deleting it.
Reminders
Every parameter can have an alarm reminder. The quickest method: long-press a parameter in the list → “Reminders”.
→ All details about schedules, snooze and reliability: Tile Reminders